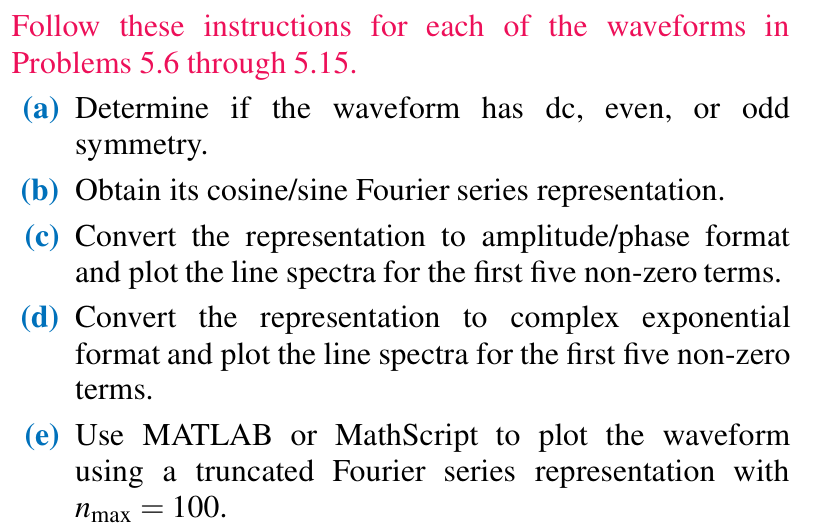
Follow these instructions for each of the waveforms in Problems 5.6 through 5.15. (a) Determine if the waveform has dc, even, or odd symmetry. (b) Obtain its cosine/sine Fourier series representation. (c) Convert the representation to amplitude/phase format and plot the line spectra for the first five non-zero terms. (d) Convert the representation to complex exponential format and plot the line spectra for the first five non-zero terms. (e) Use MATLAB or MathScript to plot the waveform using a truncated Fourier series representation with nmax = 100. 5.6 Waveform in Fig. P5.6 with A = 10. Figure P5.6: Waveform for Problem 5.6.